Ensuring healthier growth, stronger immunity, and optimal productivity for cattle, poultry, goats & all farm animals with scientifically formulated feed and supplements.
Quality, innovation and animal nutrition you can trust.
Providing scientifically formulated livestock feed and nutritional supplements that support healthy growth, strong immunity, and improved farm productivity.
Balanced protein, minerals, and vitamins designed to improve milk yield, digestion, and overall herd health.
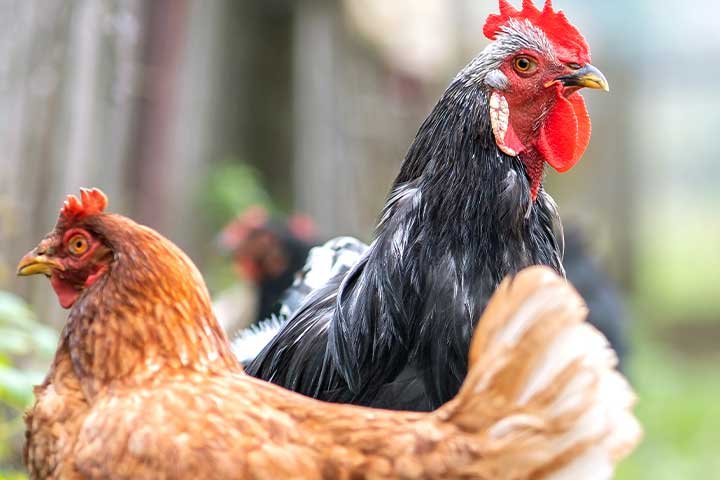
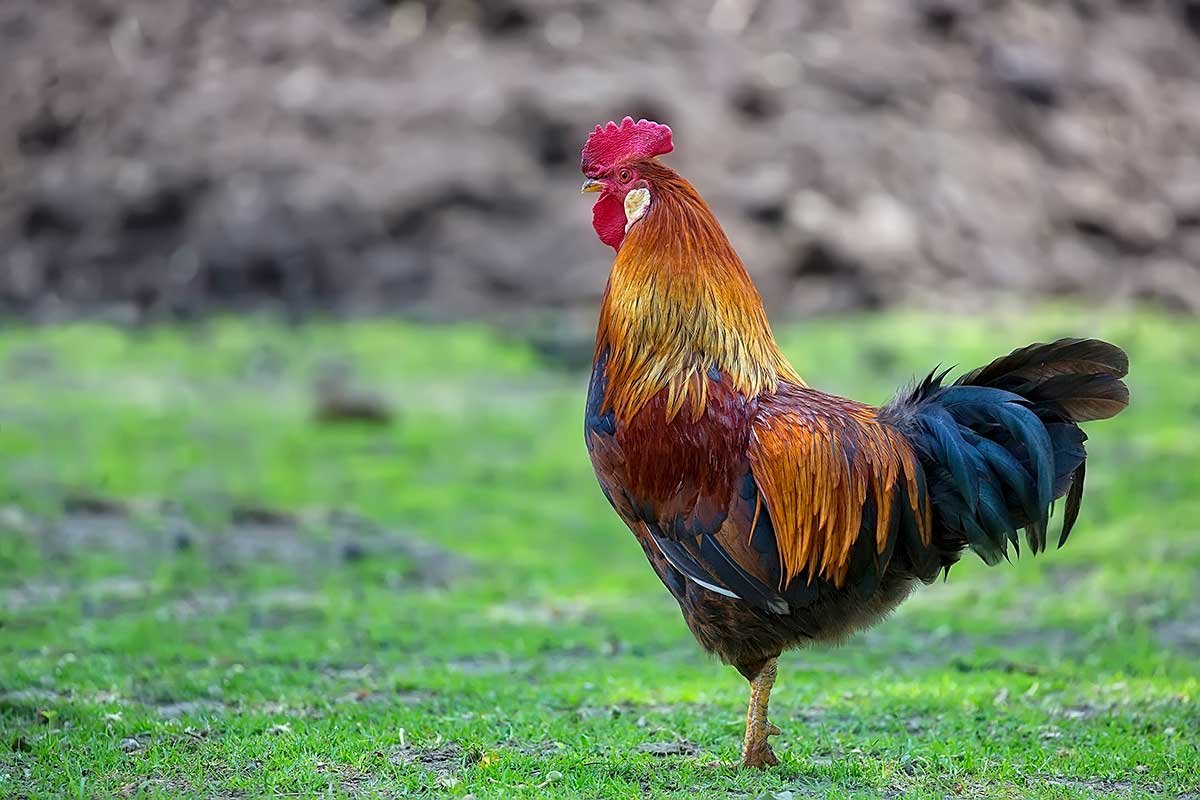
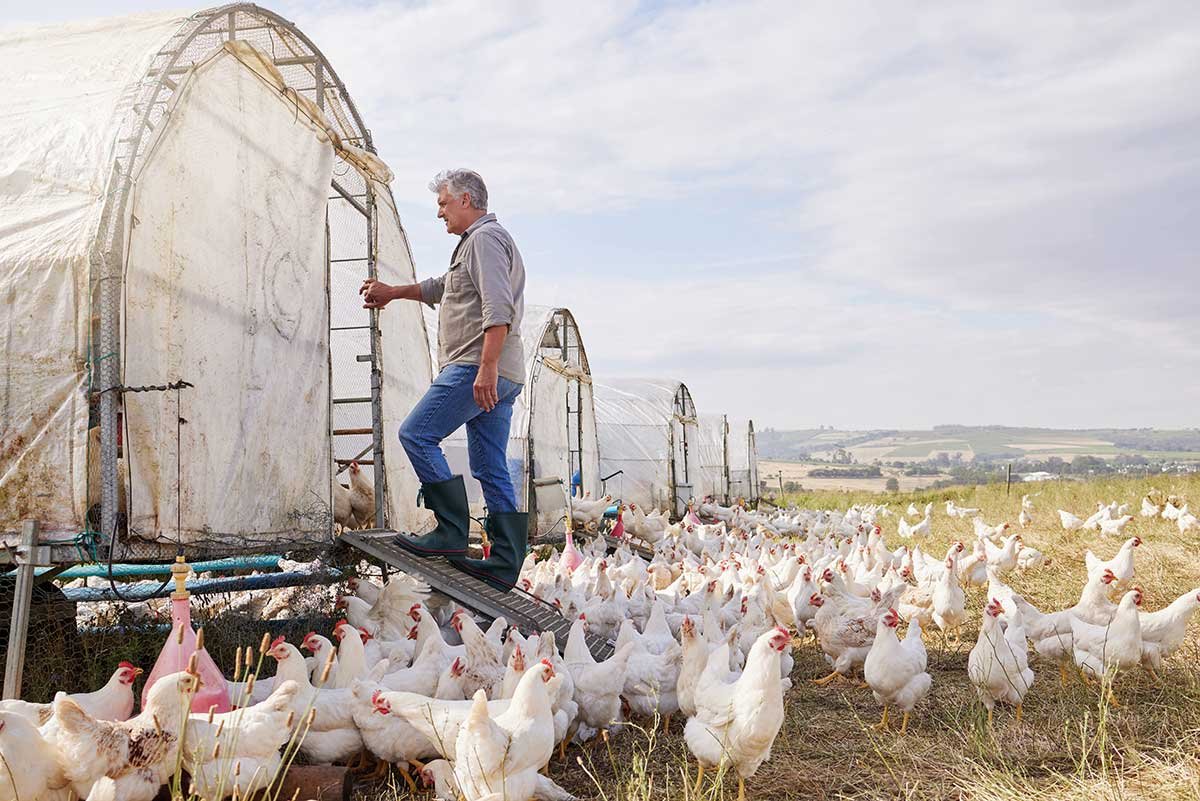
Poultry Feed
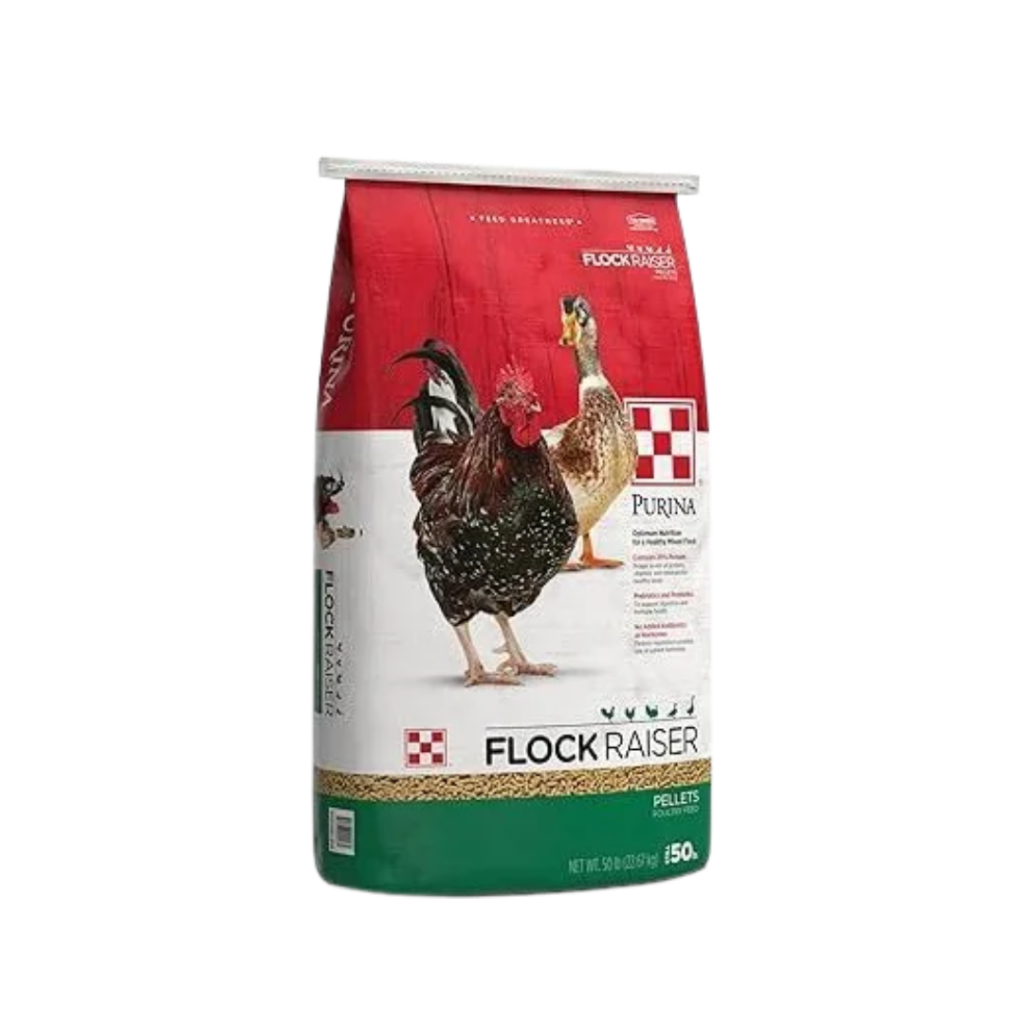
High-energy feed mixes that promote better weight gain, stronger immunity, and improved egg production.
Mineral Mixtures
Premium mineral blends enriched with calcium, phosphorus, trace elements, and essential nutrients for robust animal performance.
Veterinary Supplements
A range of boosters including probiotics, multivitamins, electrolytes, and immunity enhancers for healthier livestock.
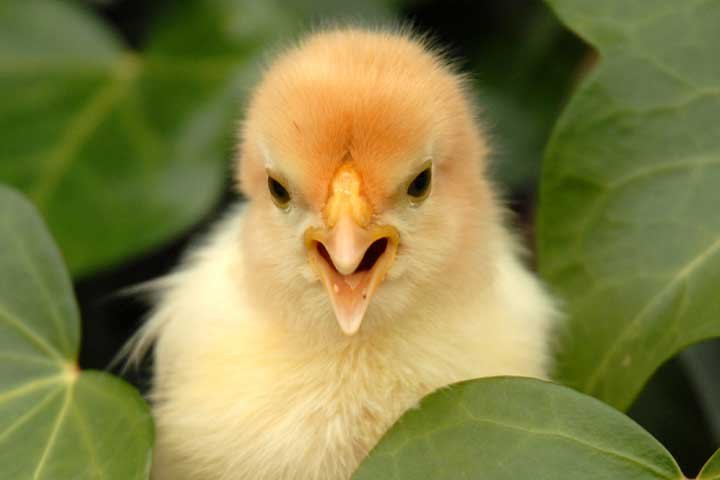
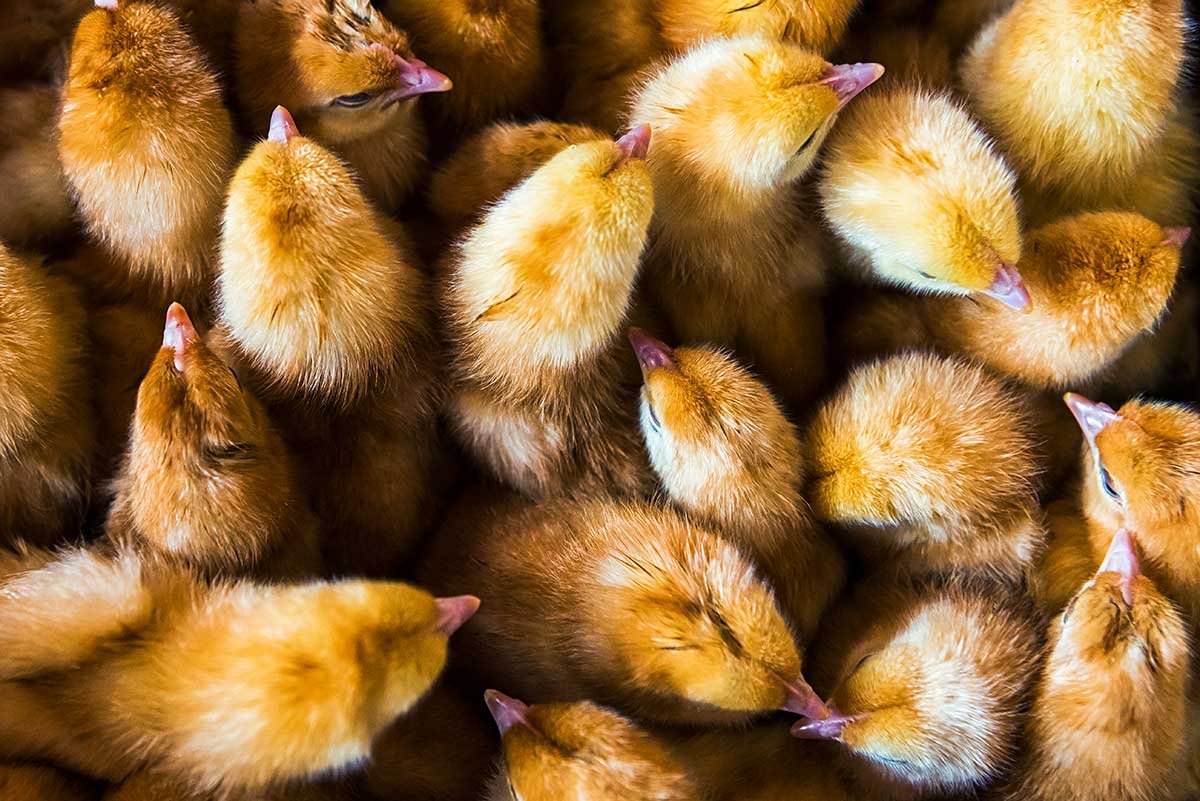
Baby Chicken Feed
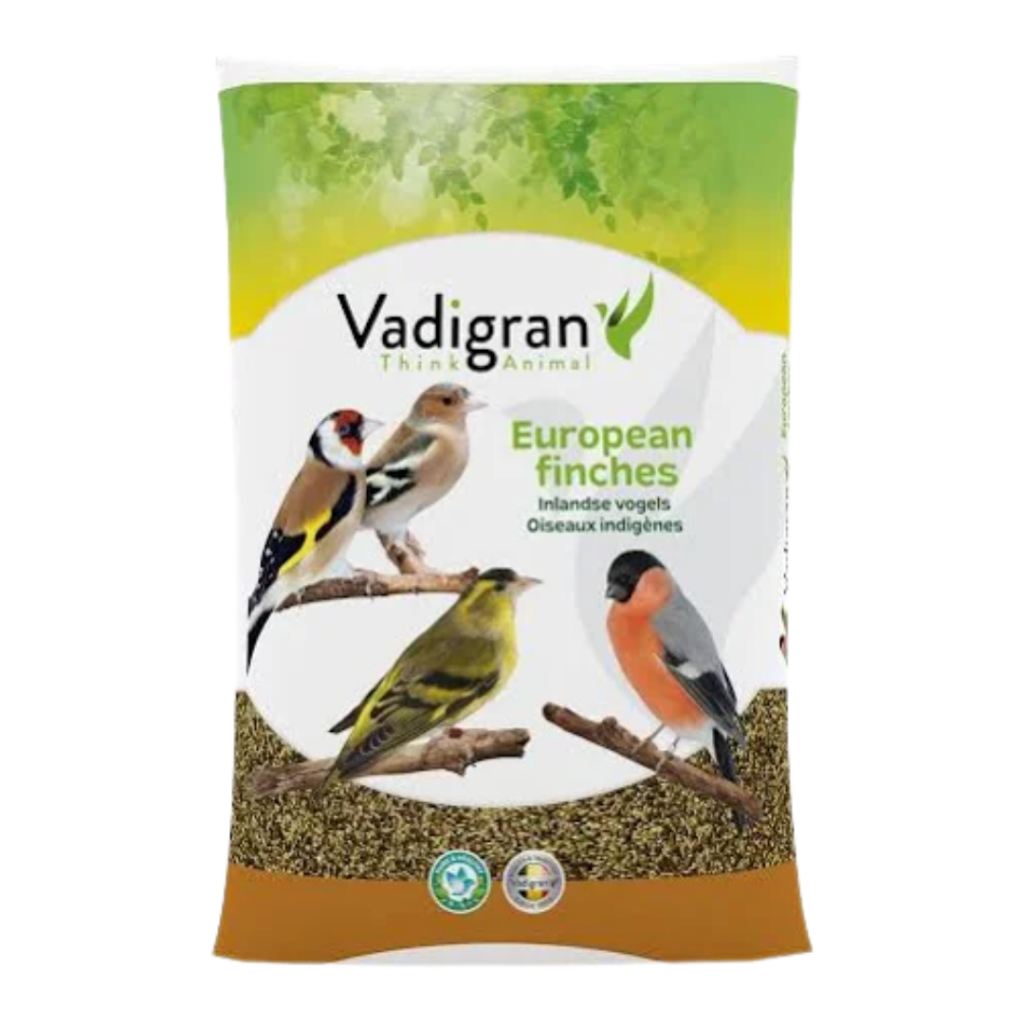
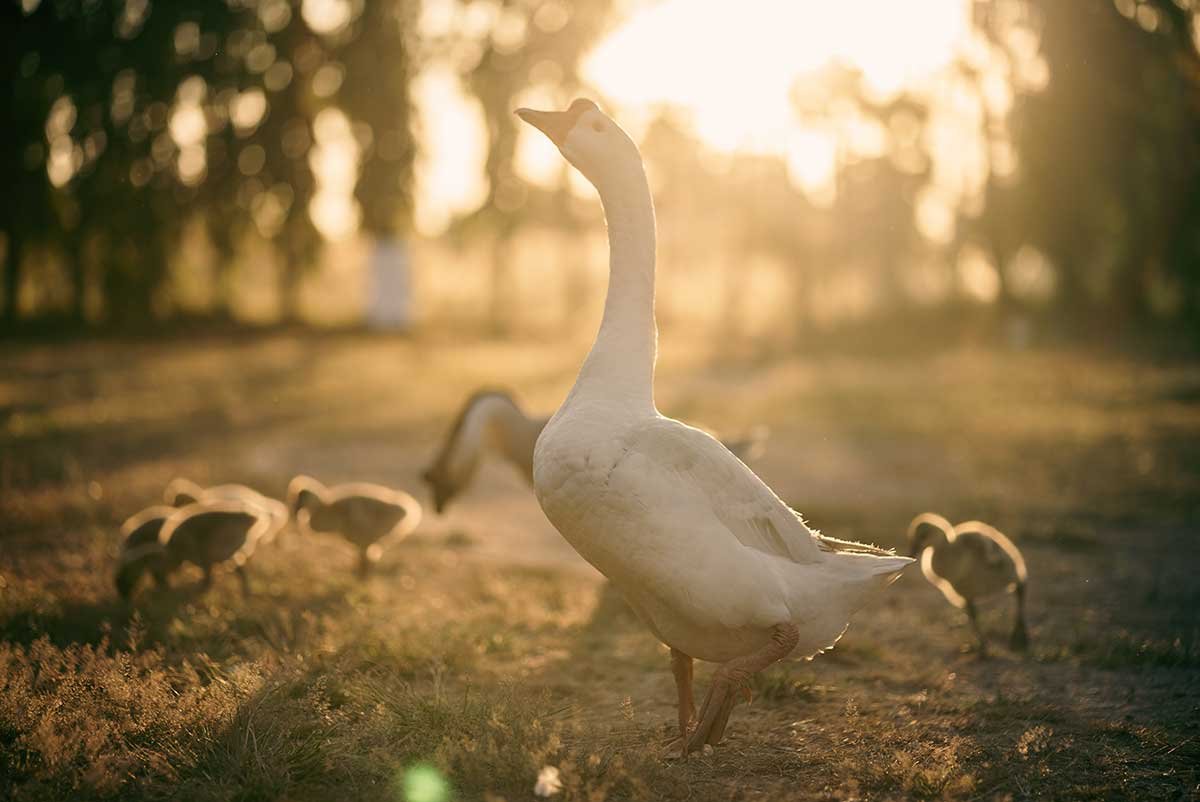
Birds Feed
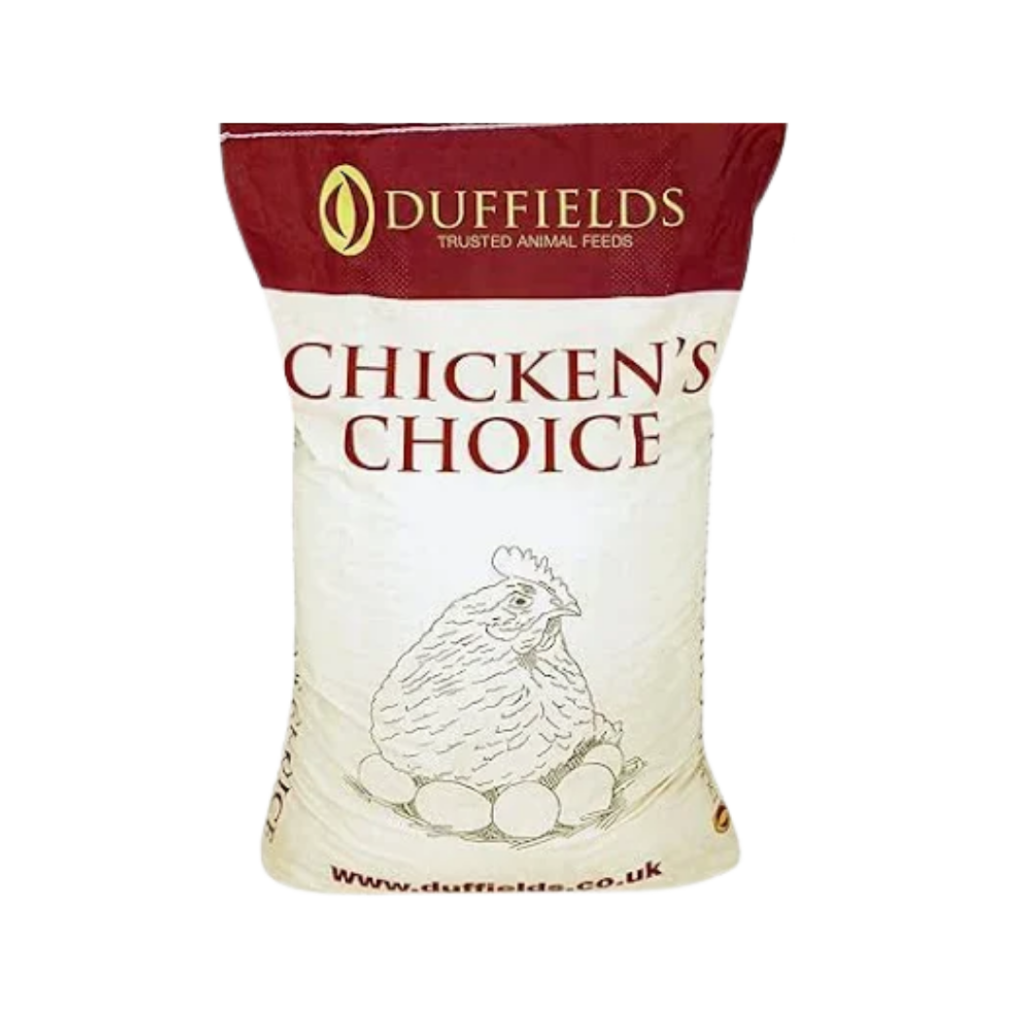
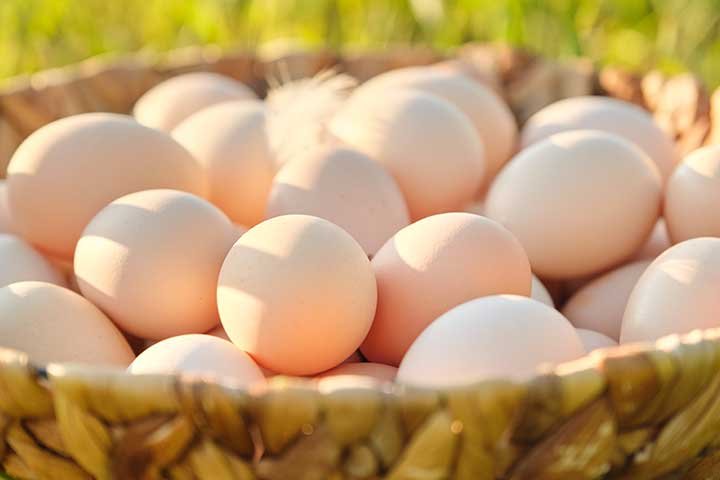
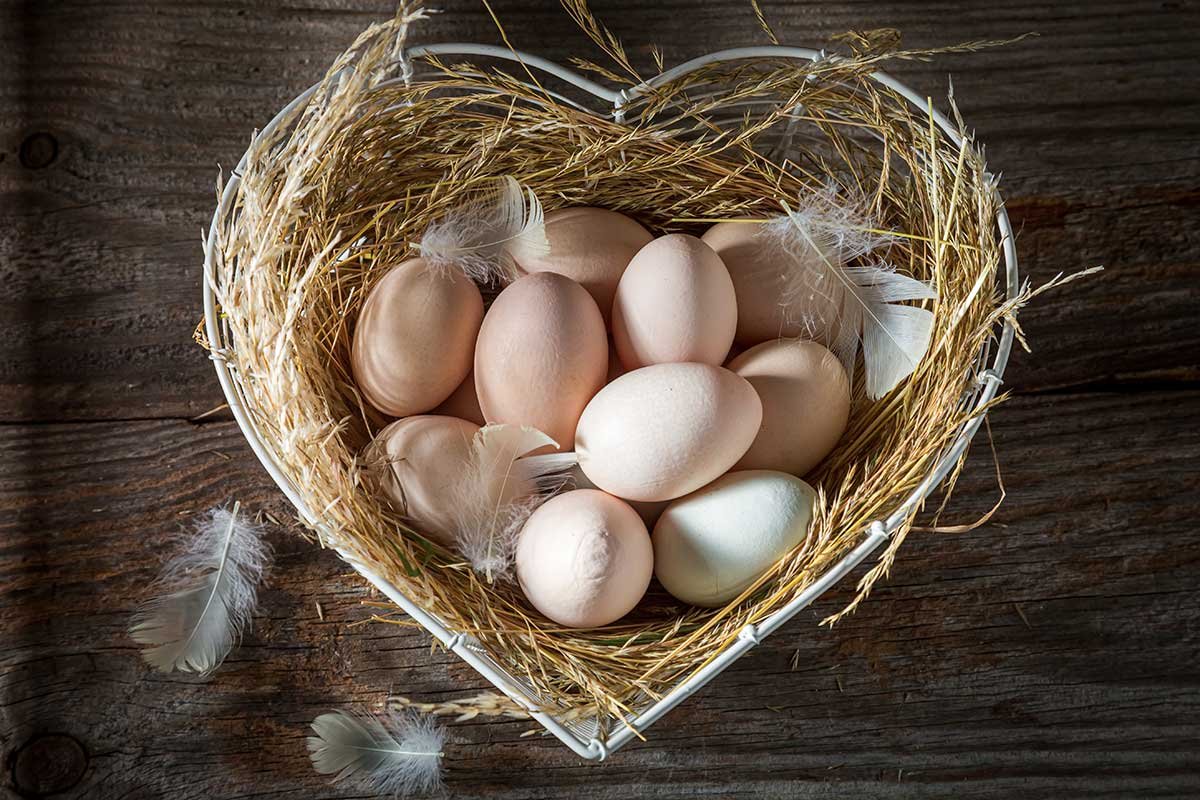
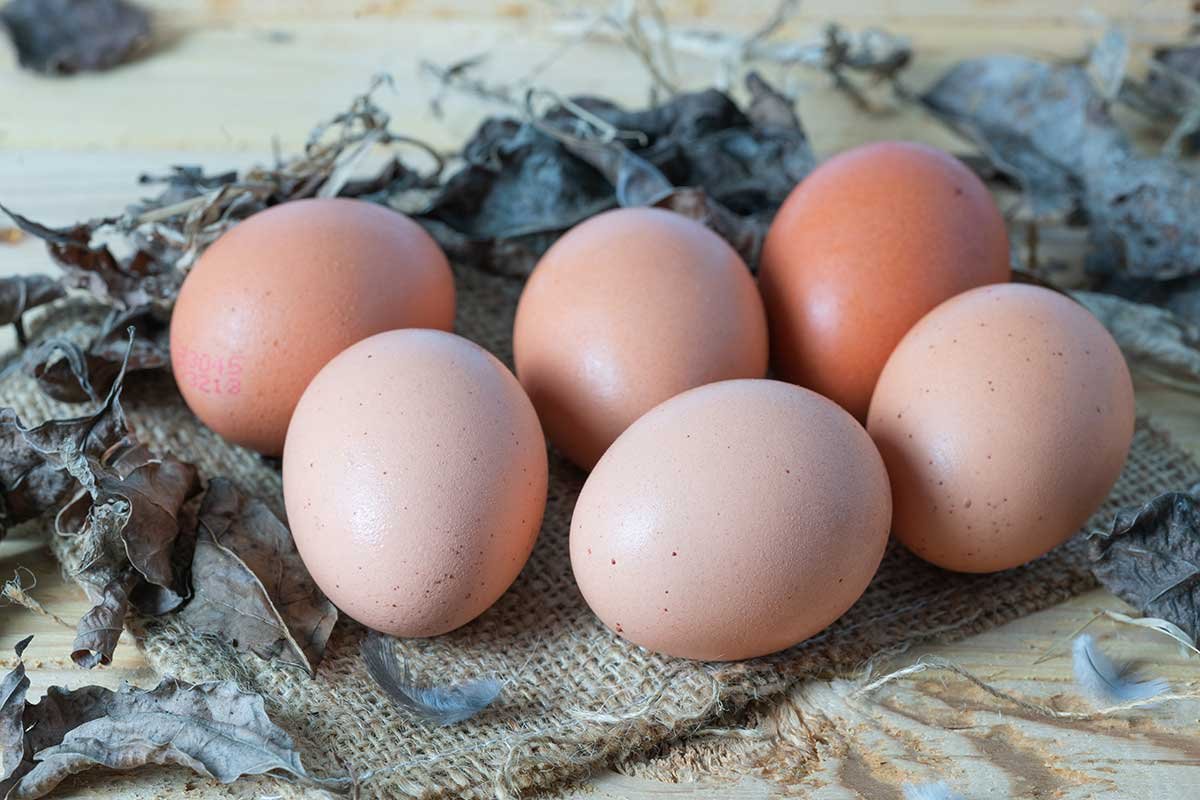
Chicken Egg Feed
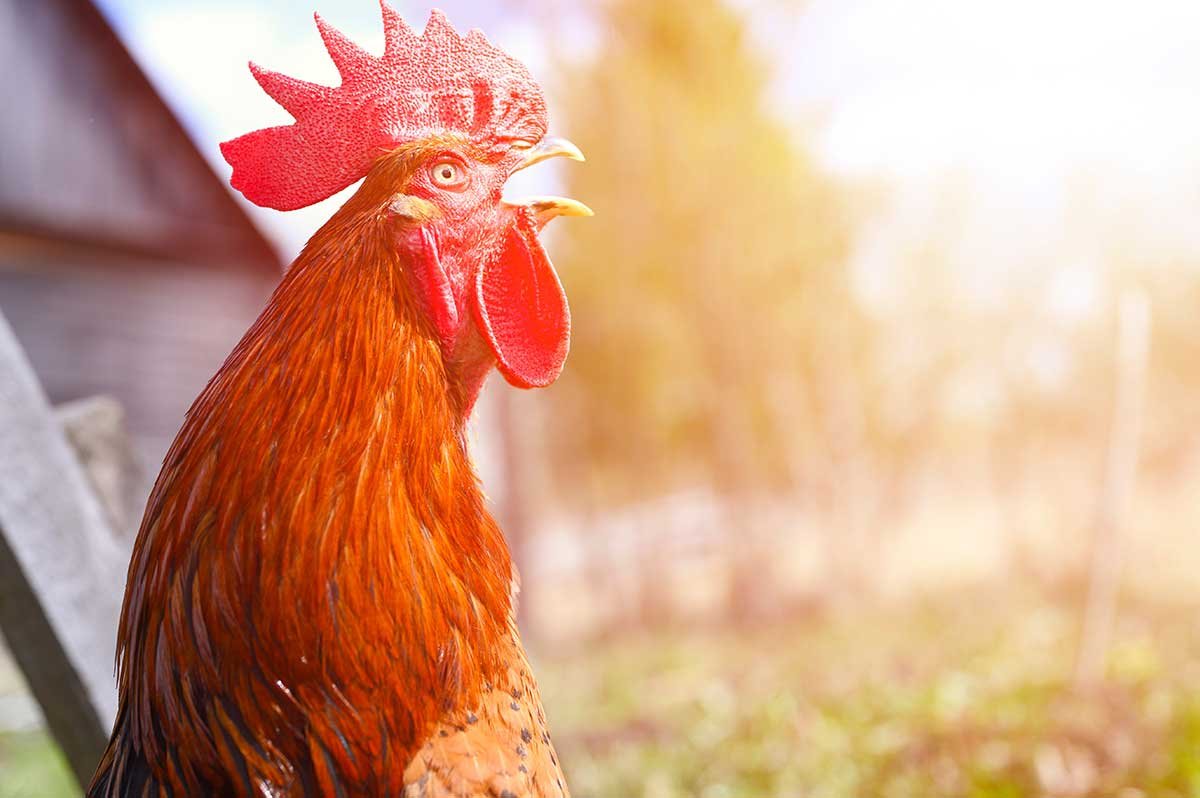
Corn Male Feed
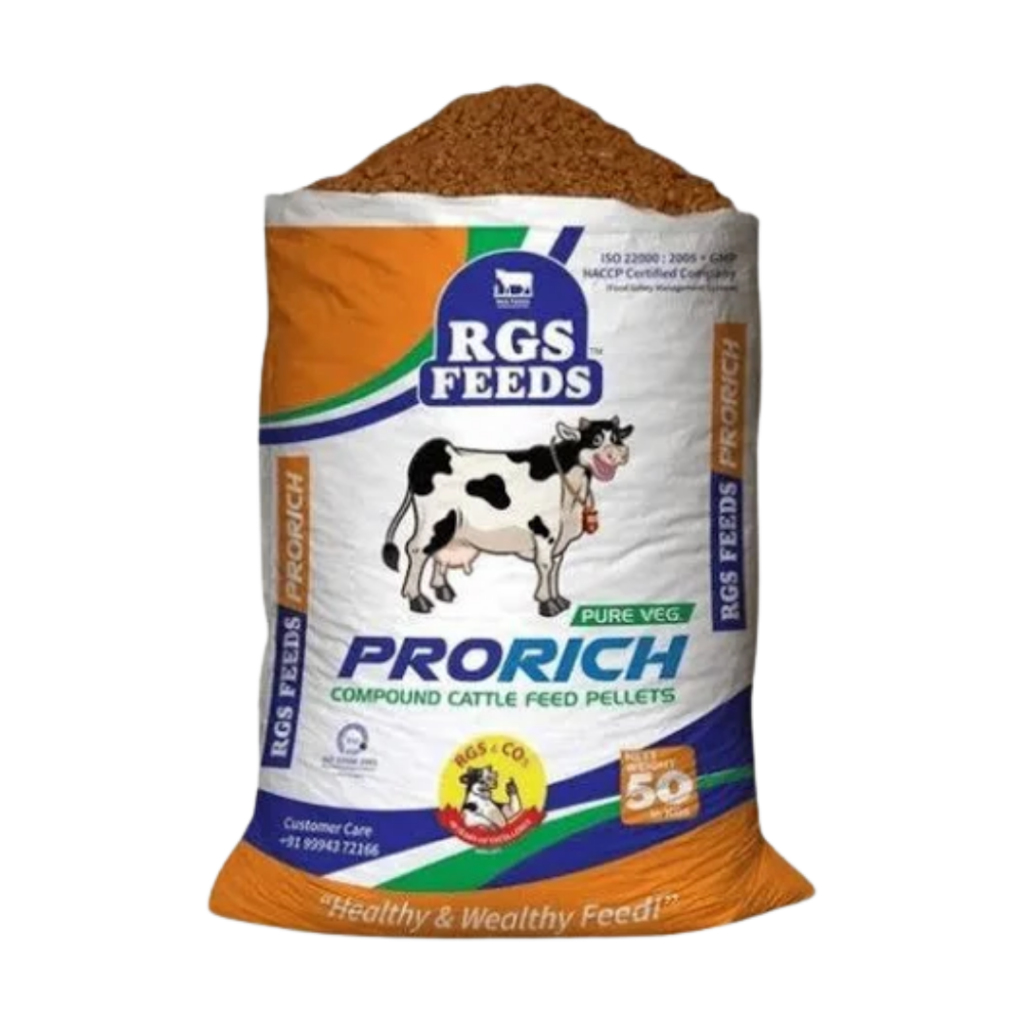
Cow Milker Feed
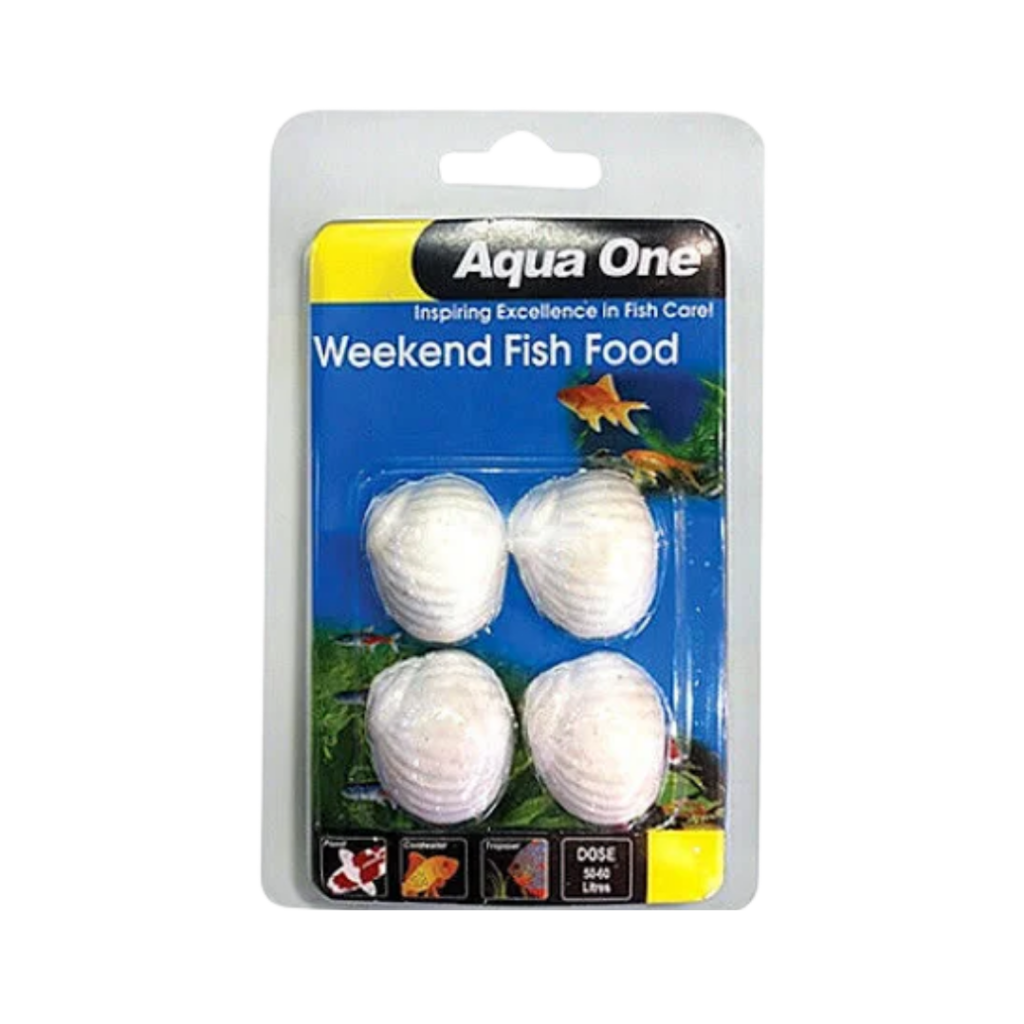
Fish Feed
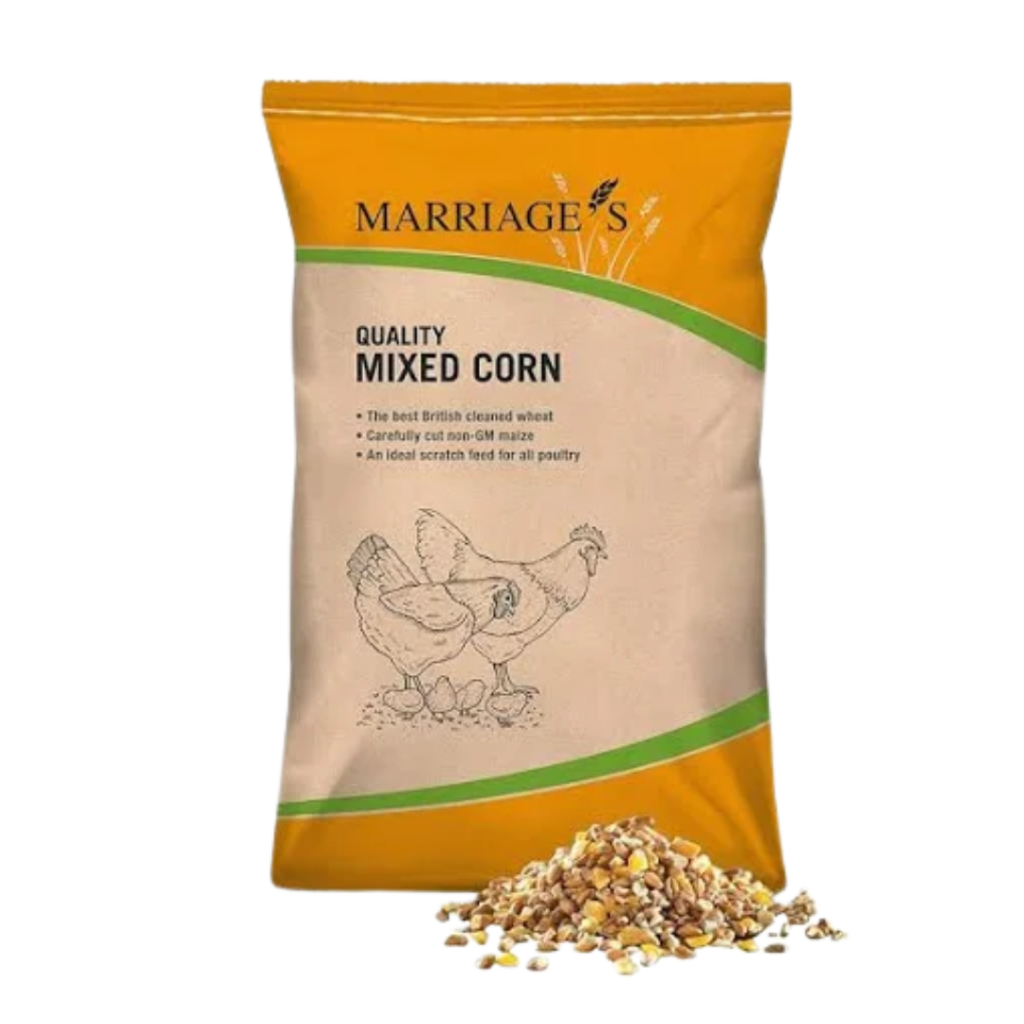
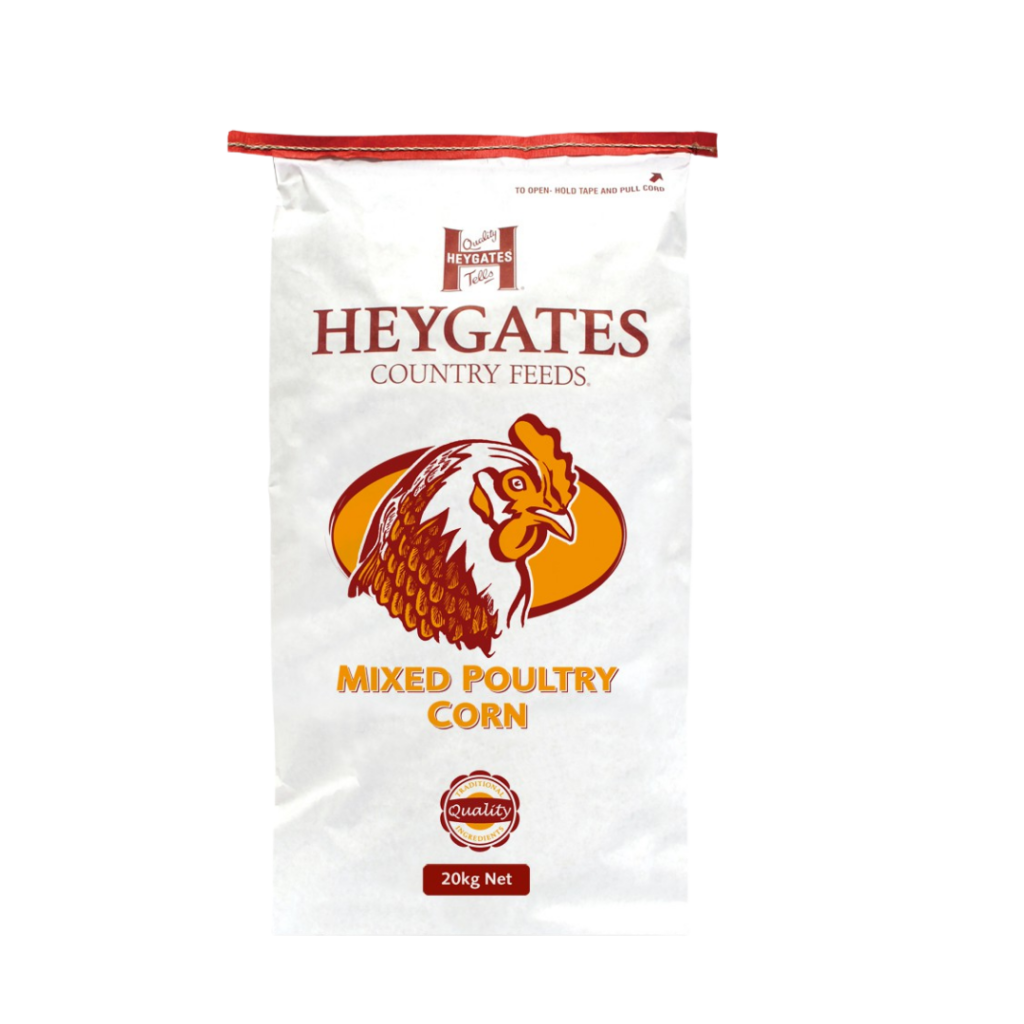
mixed poultry corn
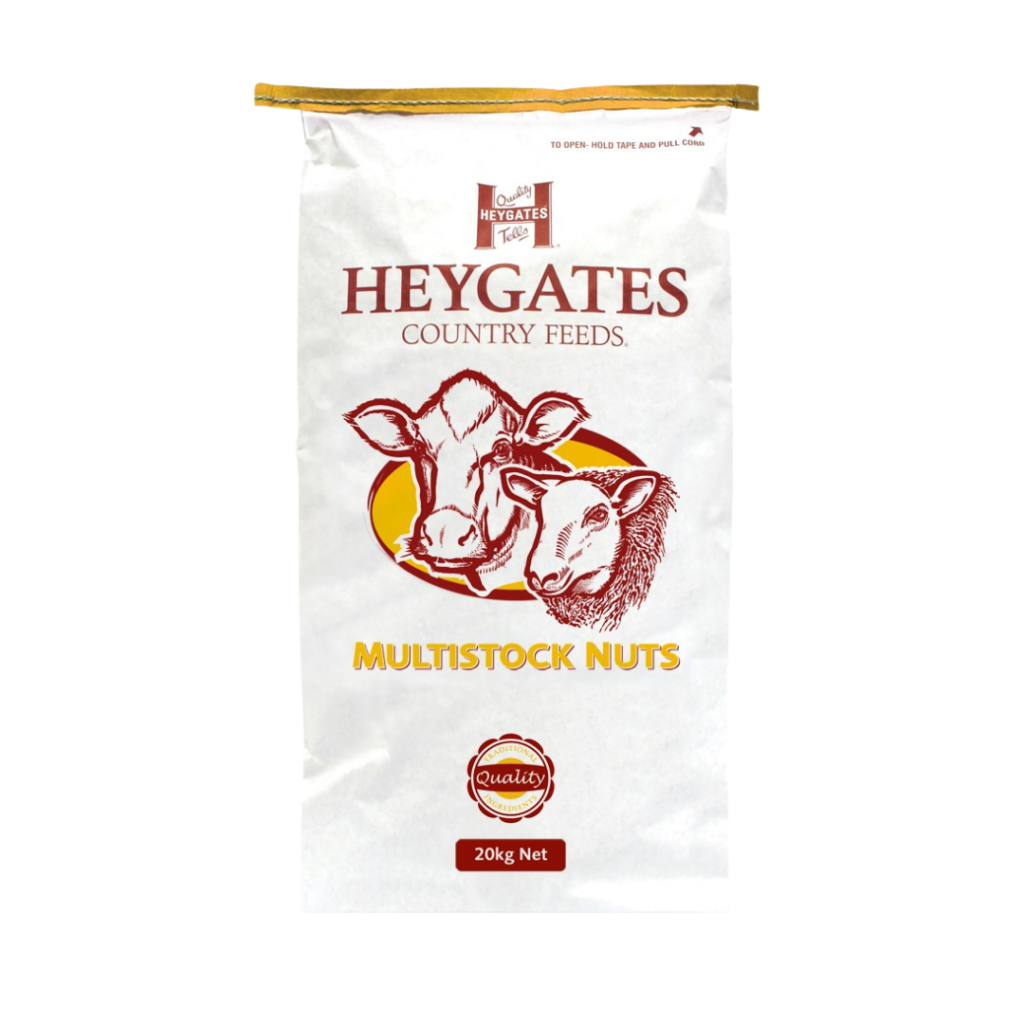
multistock nuts
They are all organic
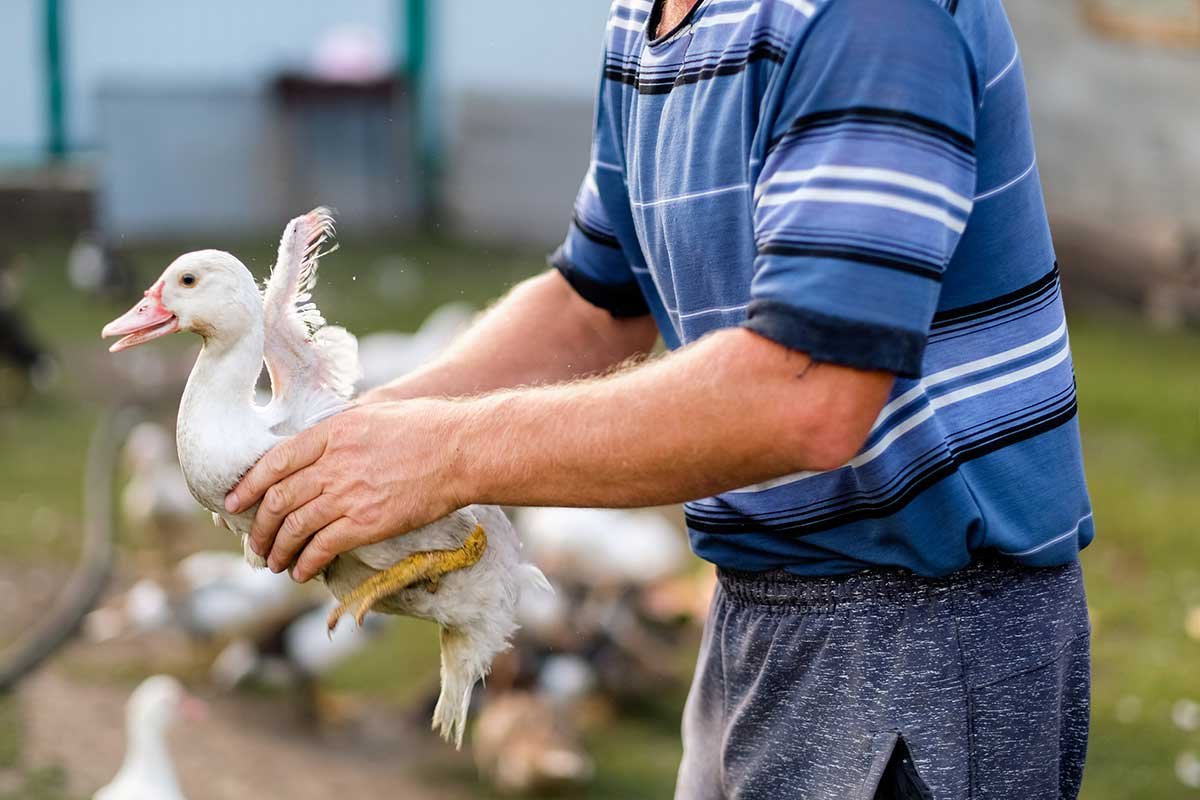
We take care of your livestock’s health
At Kotwal Enterprises, every feed formula and nutritional supplement is crafted with animal well-being in mind. Our products are enriched with essential minerals, proteins, vitamins, and immunity boosters that support healthy growth, better productivity, and long-term farm sustainability.
We partner with farmers to ensure their cattle, poultry, and livestock receive reliable, safe, and effective nutrition—every single day.
Kotwal Enterprises has completely transformed the health of our dairy cattle. Their mineral mixtures and feed supplements have noticeably improved milk yield and overall stamina. Truly reliable products!
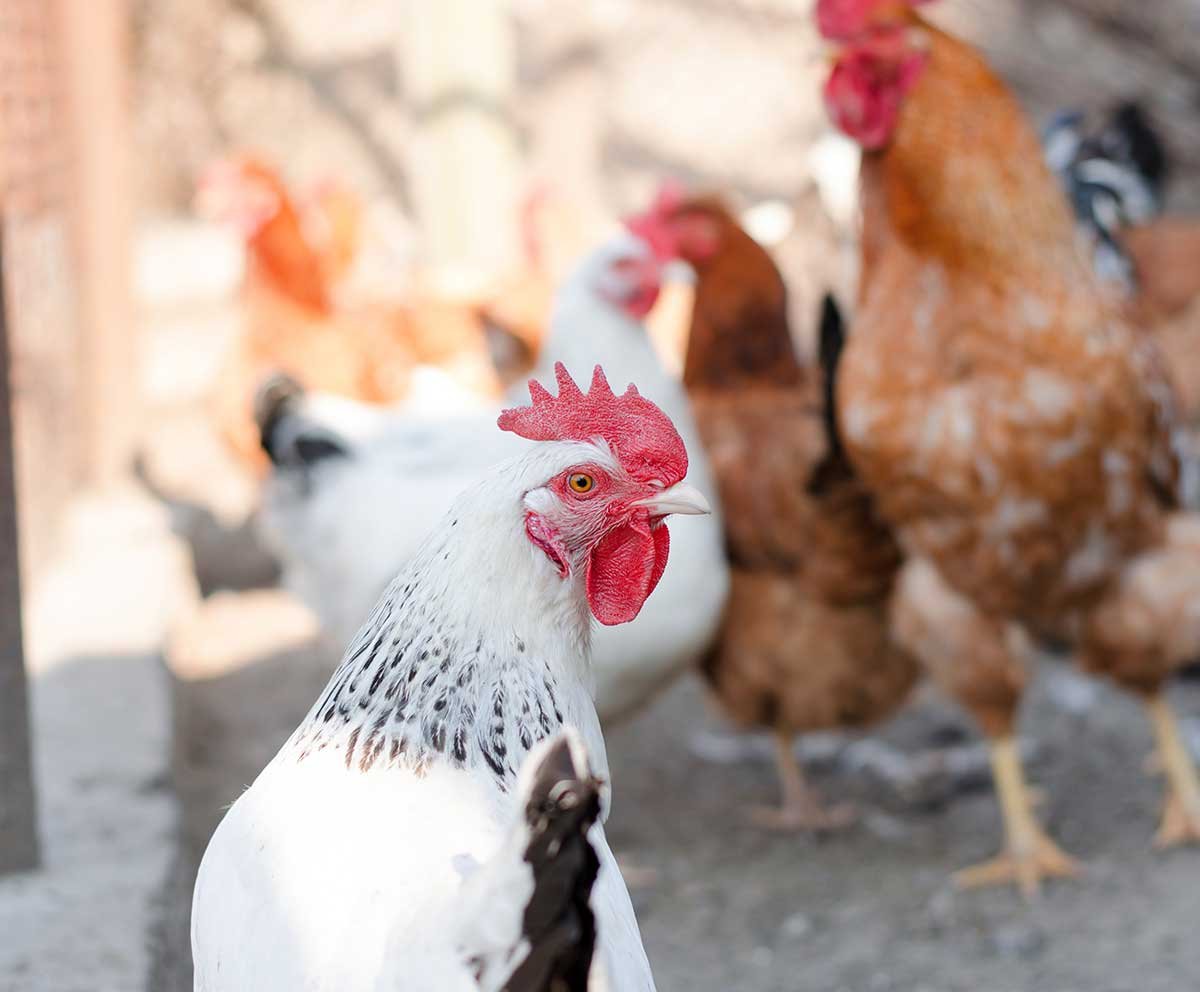
We’ve been using their poultry feed and immunity boosters for over a year now. The growth rate, feather quality, and flock health have improved beyond expectations. Highly recommended for any poultry farm.
What I like most is their consistency and support. Kotwal Enterprises not only supplies high-quality livestock nutrition but also guides us with proper feeding practices. A trustworthy partner for farmers.